

DebugView (also called “debug mode”) is a cool feature of GA4 that allows you to test the analytics system and check event and conversion tracking. Beginners often have problems with DebugView not working. In fact, you need to know how to activate it.
2 main ways to activate DebugView in Google Analytics 4:
Method #1: Google Analytics Debugger browser extension
This is the way I have been using myself for many years. But it is only suitable for those who use the Chrome browser. You can install the extension by the link.
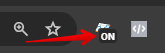
Now, to activate DebugView, just click on the extension icon. After that, the page will reload and the extension icon will have the inscription “ON”. That’s it, DebugView is activated and you can test Google Analytics.
Method #2: Tag Assistant service
This method is suitable for those who do not use any other browser (not Chrome). You need to go to tagassistant.google.com. Next, click “Add domain”, enter the website address (always with “https://”) and click “Connect”:

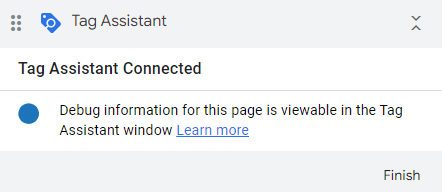
After that, a new page with the site will open and if everything is done correctly, you will see the following plate on the bottom right:
Де знайти DebugView в Google Analytics 4
Now we need to go to the Google Analytics section, where we can see all our actions recorded by the analytics system.
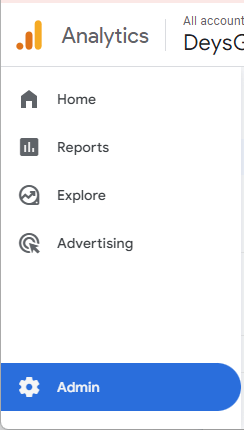
First, go to the left panel and select the “Administrator” section:
Then look for the “DebugView” section in one of the blocks of the admin panel:

How to use DebugView in Google Analytics 4
When you have activated the testing mode using one of the two methods described above, you will start to see all the actions you perform on the site in the DebugView section:
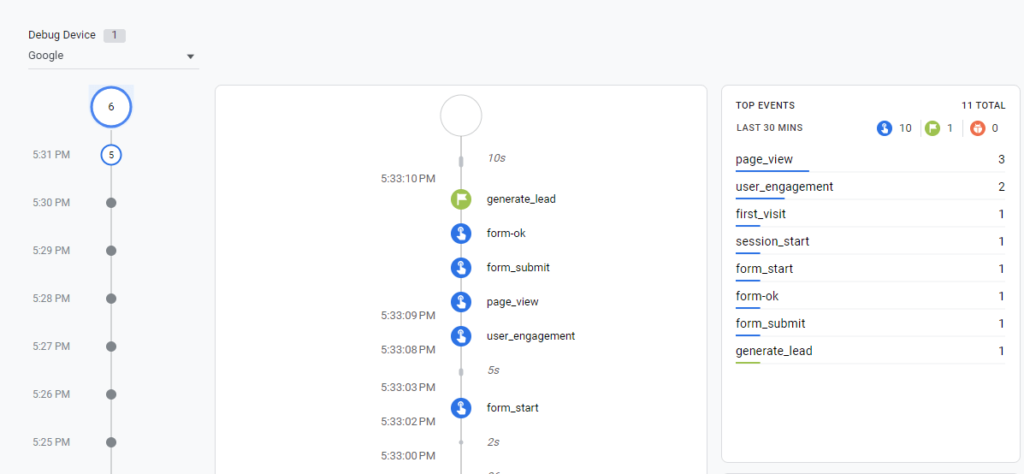
In the block in the middle, you will see everything that Google Analytics records by the second. Blue is the color of events, green is the color of conversions.
Most often, DebugView is used to test conversion tracking. In the example above, Google Analytics recorded the “generate_lead” conversion after I submitted a form on the client’s website.
If you have activated the test mode, but DebugView does not work and you do not see any events, try one of the options below:
- Wait a couple of minutes, because the system usually pulls up the first events with a delay
- On the top left, select “Google” device
- Click on pause in the left corner of the center block and then click again to resume tracking:


